The purpose of a dashboard within an ERP is to provide each user with key data (KPIs) referring to their job. This way, each user can quickly see how they are perforimg and take appropriate action when necessary. In order to achieve this the dashboard needs to be easliy configurable, and extendable. The KwaMoja dashboard fulfils all these criteria.
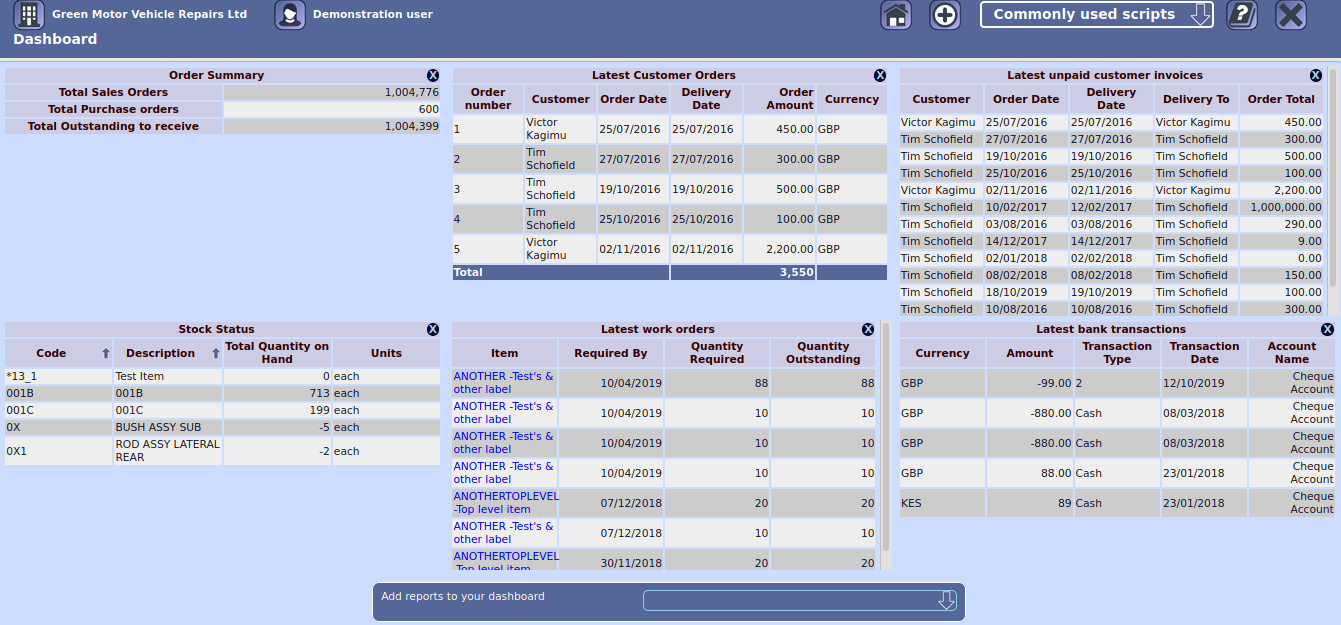
The main dashboard screen itself is found by clicking on the dashboard icon in the header of each KwaMoja screen. The screen consiists of two rows of the mini reports, with a maximum of 6 mini reports allowed for each user. Reports can be removed by clicking on the "X" on the right hand side of the header row for the mini report in question. New reports can be added by using the drop down list at the bottom of the screen. Each report is designed to represent one KPI.
A few sample reports are included with KwaMoja, but it is envisaged that companies will wish to extend the dashboard by writing their own mini reports. This only requires a small amiunt of knowledge regarding of SQL and HTML, and can easily be picked up.
To facilitate this KwaMoja comes with a template designed to be used for creating new mini reports. This template can be found at dashboard/template.php. The first stem is to copy this file and rename the copy for our new report. It must be stored in the dashboard/ sub folder, and have an extension of .php. For this example we will create a report showing the most recent goods received. Let us call this report latest_grns.php, and store it in the dashboard sub folder.
The first section of the template file is as follows:
/**********************************************************/
$PathPrefix = '../';

if (basename($_SERVER['SCRIPT_NAME']) != 'Dashboard.php') {
	require_once ($PathPrefix . 'includes/session.php');
	$DashBoardURL = $RootPath . '/Dashboard.php';
}

$ScriptTitle = _('Enter the script title here');

$SQL = "SELECT id FROM dashboard_scripts WHERE scripts='" . basename(basename(__FILE__)) . "'";
$DashboardResult = DB_query($SQL);
$DashboardRow = DB_fetch_array($DashboardResult);

echo '<div class="container">
		<table class="DashboardTable">
			<tr>
				<th colspan="5">
					<div class="CanvasTitle">', $ScriptTitle, '
						<a class="CloseButton" href="', $DashBoardURL, '?Remove=', urlencode($DashboardRow['id']), '"
						target="_parent" id="CloseButton">X</a>
					</div>
				</th>
			</tr>';
/* The section above must be left as is, apart from changing the script title.
 * Making other changes could stop the dashboard from functioning
*/
All we need to do here is to change the title of the script, so change the value of $ScriptTitle to _('Latest goods received notes'). The next section of the template is as follows:
/**********************************************************************/
$SQL = "";
$DashboardResult = DB_query($SQL);
/* Create an SQL SELECT query to produce the data you want to show
 * and store the result in $DashboardResult
*/
This is where some basic knowledge of SQL is needed. We need to create a simple SELECT statement that retrieves the columns that we require. Looking at the grns table in the database we need the columns `grnno`, `deliverydate`, `itemcode`, `itemdescription`, and `qtyrecd`. The SQL statement then becomes
In other words we pull the 5 fields from table grns, sequence them by descending order of delivery date, and just retrieve the most recent 15 GRNs. This is then assigned to the $SQL variable in the script.
The next part of the template is for the column headings:
/**********************************************************************/
echo '<thead>
		<tr>
			<th>Column 1</th>
			<th>Column 2</th>
			.................
			.................
			<th>Final Column</th>
		</tr>
	</thead>
	<tbody>';
/* Create the table/column headings for the output that you want to show
*/
Within each <th></th> pair we need to enter a header for every column. This will look something like this:
<th>', _('GRN Number'), '</th>
<th>', _('Delivery Date'), '</th>
<th>', _('Item Code'), '</th>
<th>', _('Description'), '</th>
<th>', _('Quantity'), '</th>
The next part of the template displays the individual lines of the report:
/**********************************************************************/
while ($MyRow = DB_fetch_array($DashboardResult)) {
	echo '<tr class="striped_row">
			<td>Text Data 1</td>
			<td class="number">Numerical Data 2</td>
			....................
			....................
			<td>Final Data</td>
		</tr>';
}
/* Iterate through the rows of data returned by our SQL and create table
 * rows for each record
*/
Within each <td></td> pair we need to enter a variable containing the data for every column. This will look something like this:
<td>', $MyRow['grnno'], '</td>
<td>', $MyRow['deliverydate'], '</td>
<td>', $MyRow['itemcode'], '</td>
<td>', $MyRow['itemdescription'], '</td>
<td>', $MyRow['qtyrecd'], '</td>
The final section of the template just ensures that the table gets closed properly:
/**********************************************************************/
echo '</tbody>
	</table>';
/* Don't forget to close off the table */
The final stage, is to tell KwaMoja about the new mini report, and to configure it's security settings, and description. This is done via the 'Configure the Dashboard' option on the 'Setup' menu.
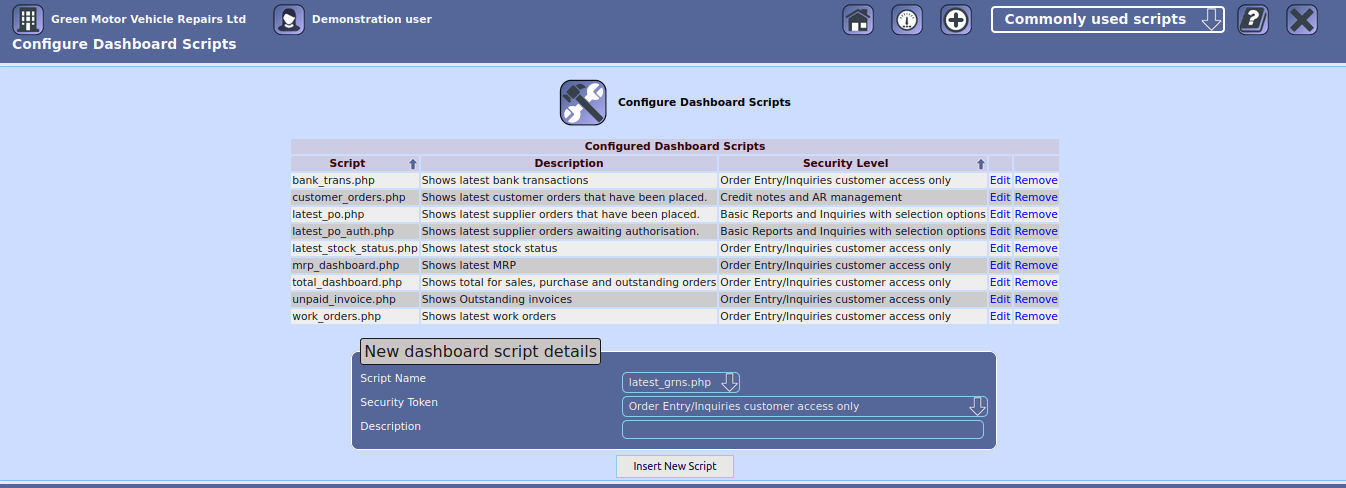
On this screen any scripts that are not currently installed are listed in the drop down section in the input section:

As can be seen only our new script is waiting to be installed so we select that.
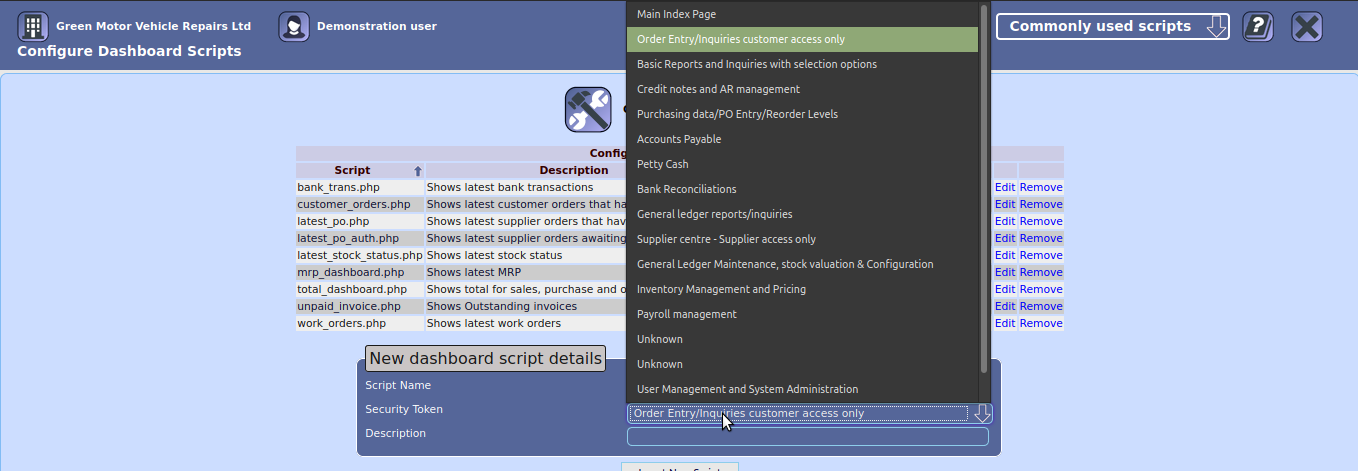
Next we choose what security token to allocate to this script. This decides who will be able to have it on their dashboard
Finally we input a description for this mini report. This description will appear in the drop down box on the actual Dashboard screen.